6,141 stocks · ranked weekly
Find
Your Next
#1 Stock
We find market-beating stocks. You trade.
7 days free, then $39/mo · cancel anytime
 SNDKSandisk Corp.956998369470
 LLYEli Lilly & Co.776794319794
 AMATApplied Materials, Inc.993099729882
 DELLDell Technologies, Inc.7860896610073
 MUMicron Technology, Inc.926597257653
 WDCWestern Digital Corp.924397299494
 NVDANVIDIA Corp.874099249980
 CRMSalesforce, Inc.825384909836
 STXSeagate Technology Holdings plc883398389084
 AVGOBroadcom Inc.953198378266
 AAPLApple, Inc.831599956963
 WMTWalmart, Inc.733179995984SNDKSandisk Corp.LLYEli Lilly & Co.AMATApplied Materials, Inc.DELLDell Technologies, Inc.MUMicron Technology, Inc.WDCWestern Digital Corp.NVDANVIDIA Corp.CRMSalesforce, Inc.
See your rankings
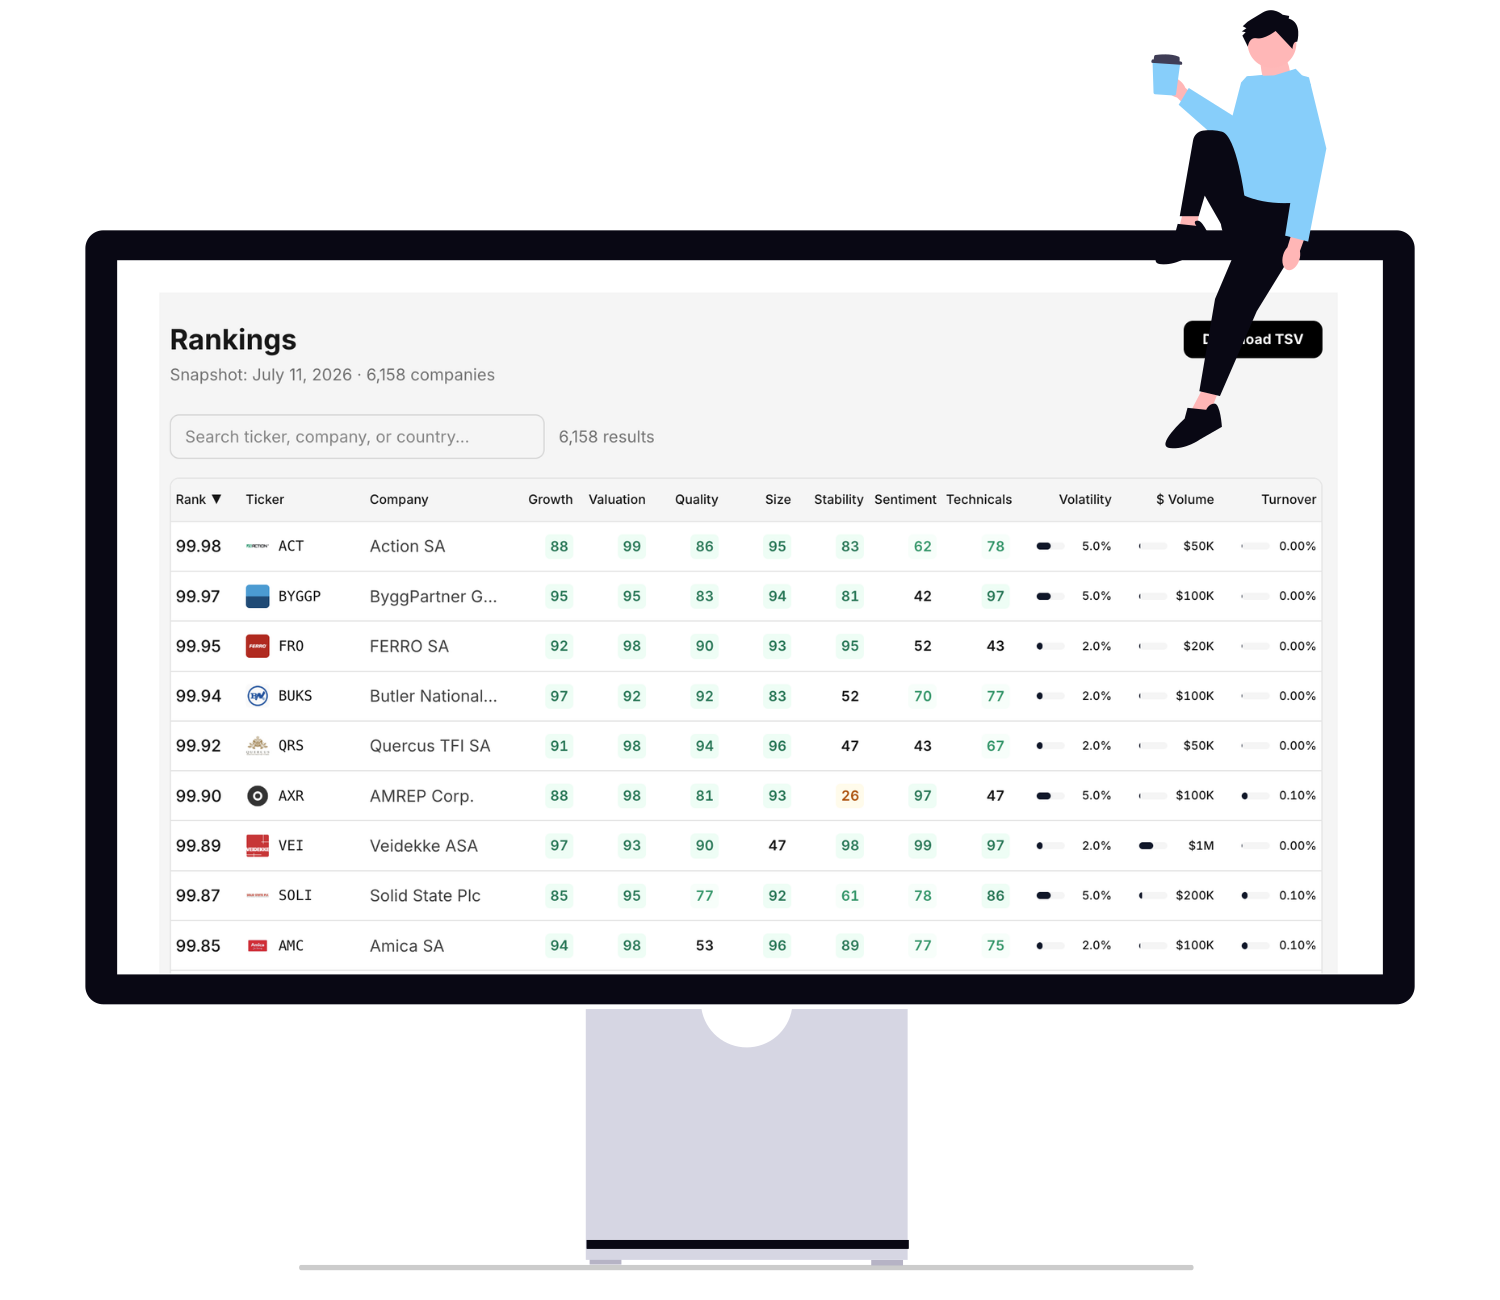
Every week we grade 6,141 companies across 23 countries and rank them from 0 (worst) to 100 (best). And we don't just give you a ticker — we show you why each company ranks where it does.
| Rank | Company | Best scores | Price |
|---|---|---|---|
| 86 | Sandisk Corp. SNDK · Technology 🇺🇸 | Quality 98Growth 95 | $1,633 |
| 81 | Eli Lilly & Co. LLY · Healthcare 🇺🇸 | Sentiment 97Quality 94 | $1,116 |
| 79 | Applied Materials, Inc. AMAT · Technology 🇺🇸 | Quality 99Growth 99 | $456.49 |
| 76 | Dell Technologies, Inc. DELL · Technology 🇺🇸 | Sentiment 100Quality 89 | $567.29 |
| 76 | Micron Technology, Inc. MU · Technology 🇺🇸 | Quality 97Growth 92 | $975.26 |
| 76 | Western Digital Corp. WDC · Technology 🇺🇸 | Quality 97Sentiment 94 | $447.18 |
Every stock is scored on seven things that drive returns — growth, value, quality and more. The chips show where each company scores best.
All 6,141 rankings →Create your own strategy
Build your own strategy from the stocks we rank — free. Want to see what your own strategy could look like? Ours runs in public, tracked weekly. Prefer ready-made? Follow a US large-cap model with Membership and get your weekly trade list.
Back-tested to the dashed line, live from Jul 2024. Rebased to 100 at Jan 2002and shown on a log scale against the S&P 500. Past performance, simulated or real, does not predict future results.
Connect your broker
Link your brokerage account to RankEq in a couple of clicks. Your money never moves — it stays in your own account, and RankEq never holds client funds.










Your money never moves — it stays in your own account.
Place your trades
Each week RankEq works out what to buy and sell to match your strategy and lines up the orders. You review them and send them to your broker in one click — you decide on every trade, and nothing goes through without you.
Sandisk Corp.
SNDK · 12 shares
Eli Lilly & Co.
LLY · 8 shares
Applied Materials, Inc.
AMAT · 15 shares
Dell Technologies, Inc.
DELL · 5 shares
Built on institutional-grade data
 Fundamentals & estimates
 Source filings & disclosures
 Prices & volume · NYSE operator
 Short interest reporting
Fundamentals and consensus estimates from FactSet, standardized from SEC filings and company announcements so companies are comparable; prices from ICE, the operator of the New York Stock Exchange; short-interest data reported through FINRA. The history keeps delisted companies, so backtests aren't flattered by survivorship bias.
Get Access Today.
See every stock through our rankings, follow a strategy that acts on them — or build your own, test it against 27 years of market history, and let it re-pick weekly like ours do. Use it as your whole system or as a second opinion beside your own picks. Whether you are a seasoned investor or just starting out — these systems are for you.
★★★★★
“It's like slipping on X-ray lenses for the market — observe every company through the Ranking, see the example Strategy, and mirror the top stocks on your own.”
Free
PER MONTH
- ✓ Access to free articles
- ✓ Access to the free E-book
- ✓ The free Example StrategyHoldings are shown with a two-week delay for free users
- ✓ Broker linking — $2/mo add-onAt cost, one broker · included free with Membership
Membership
Most popularPER MONTH
or $390 yearly — 2 months free
- ✓ Everything in Free
- ✓ Access to paid articles
- ✓ Weekly rankings of 6,000+ stocks
- ✓ Three strategies of big US companies
- ✓ No capacity limit — join any time
- ✓ Rebalance alerts by email
- ✓ Broker sync + one-click rebalancing
7-day free trial · 30-day money-back guarantee · cancel anytime
A self-built strategy comes free with sign-up — its weekly holdings are shown on a two-week delay. Measured from July 2024, when it went live — forward performance, not a backtest. Returns are net of estimated trading costs; your own fills will differ. Past performance does not predict future results. Not investment advice.
Frequently Asked Questions
We try to make everything super easy, but some questions come up more than others. Check the answers out below. Have more questions? Reach out to us via X or E-mail.
What is a Top Ranked stock?+
A Top-Ranked Stock in our system is a company that scores in the very highest tier of our composite factor model — a multi-dimensional scorecard that blends seven proven drivers of long-term equity returns: growth, valuation, quality, stability, sentiment, technicals and size.
What makes the Ranking unique?+
Our ranking process transforms diverse factor signals into a unified, rank-ordered list. Each metric is first normalised and then blended through a customisable weighting scheme to produce a single composite score. Every factor must clear a gauntlet of timelessness, universality, and boot-strapped subsample tests before it earns a place.
How does Rank Equity manage risk?+
Short-term volatility is inevitable, so we manage risk by picking high-quality businesses rather than hedging or shorting. True diversification comes from ranking stocks globally — not just U.S. names — across payment systems, credit services, semiconductors, software and healthcare, and sizing each position so that every holding meaningfully contributes.
Is Rank Equity a Fund?+
Rank Equity is currently private and closed to new investment. We plan to launch formally in the near future — first by offering Separately Managed Accounts (SMAs), and later potentially through a dedicated fund structure with a strict AUM cap designed to preserve our agility and drive outsized returns.
Beyond the Herd
Most investors buy what everyone else is buying, at the moment everyone else is buying it. RankEq scores 6,000+ companies every week on the factors that have actually driven returns — so your next buy is ranked, not guessed. Pick a strategy, see every stock it holds, and trade it through your own broker.
Get Started for Free