A simple 7 factor model
July 26, 2025
Simple but robust
If you have read the E-book, then you will know that even simple models can be quite robust. Of course, they will never be as robust as models with a lot of factors. But as long as you make sure that the factors you pick are from different 'categories', you have a chance of doing well.
The model in my E-book has been doing well out of sample, see below.
Out of Sample returns
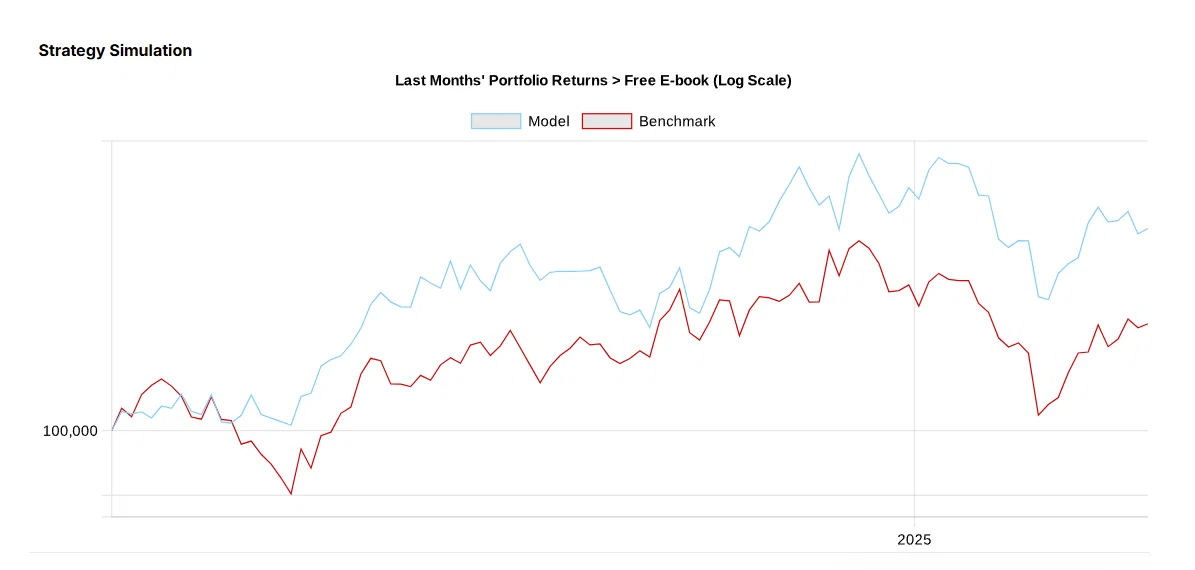
As you can see, even a very simple 7 factor model has the possiblity to shine. The funny thing is, even in such a small model, you will find some nuances.
Nuances in a simple model
Readers of the E-book will know that one factor that is used in this model is free cash flow growth over the last twelve months. One might calculate this as the free cash flow of the last twelve months minus the free cash flows of the twelve months before that and divided by the free cash flow of those same twelve months.
The formula learned in most basic school programmes around the world for percentage change : (new - old)/ old
However, this does not take into account the case where cash flows are negative. Hence, we want to change the formula to (new - old)/ abs(old), where abs stands for the absolute value (which makes negative numbes positive).
You might think we are ready to go with this definition, but actually, we are not. Because in case a company had an 'old' number that was extremely small, lets say 0.00001 because it never made a profit, or a revenue and it just landed a first sale, it will get a really big number on our metric.
Most likely, that is not what you wanted when you created the formula. If you do - as I know from experience - you will probably get a few high ranking companies that have only just started out, or just got lucky. Some biotech names come to mind.
An adjustment that we could make is to say: (new - old) / max(abs(old), 2) as an example. This will make sure that the company - in the case of cash flows - must have made some sort of cash flow (2 million) in the past for it to rank 'high'.
You can imagine that the other factors contain some nuances too. For example, we look at the changes in earnings estimates over the last 8 weeks. We can apply a similar formula for that.
What to expect in the future
Having a nice run with 7 factors doesn't really mean anything. It is pretty educational though. If we look at companies from all angles - just like we would do when we would go out and buy a house - we are more likely to do well.
If you are interested in following this model a bit, I made a separate page: www.rankeq.com/Free, where you can follow the models performance on a weekly basis.
Adding more factors improves returns. Being a bit stricter in your universe of stocks that you consider also improves returns a lot. I know this, because the returns I made over the last 5 years have far exceeded those of the free model that I offer here.
More Post
Forging Your Own Path
Congratulations on securing the Full Book—your strategic blueprint for financial mastery. Within these pages, you’ll discover actionable insights and innovative strategies that redefine your investment approach. Ready to push further? Explore our Rankings page to uncover elite performance benchmarks, or dive into our Algorithms page to harness advanced, data-driven insights that give you a competitive edge. Your journey to transforming knowledge into extraordinary returns begins now.
The Best No-BS Factor